Understanding patterns in monitoring metrics, logs and analytics.
When is it the time to get worried? When everything is on fire and your trying to put it out, wondering what the fallout will be?
Or how about when a pedestrian is about to cross the street, and you see a bus speeding down the road towards them, not slowing down?
Or when your on a beach, then an earthquake occurs, and the water starts going out very quickly?
These are all signals.
The difference between them is how long after the signal is identified, to the point of initial and maximum damage.
First I will talk about these in general term, then I will reference specific examples in IT.
If we look at the three examples given above, lets identify the signals, the impact and possible actions that can be taken.
1) Everything is on fire.
Signal: Fire is normally contained in specific locations. If there is a fire in a non-standard location, is there a reason for it? Is it under control? Is there possible risk to people, property or operations?
Impact: If everything is on fire, then some damage has already occurred. It is possible that if it is not contained immediately, then more damage may occur and the severity and scope of the damage will increase exponentially.
Action:Perform a quick situation assessment. Determine the most critical areas to fight and reduce further damage while minimizing risk. Obtain frequent progress reports and continually re-assess.
Initial damage has already occurred before the signal and cannot be prevented, but further damage can be minimized.

2) A runaway bus.
Signal: Two parties are in a collision course without any indication of either acknowledging the other or changing course.
Impact:After the signal has been acknowledged, there is a period of time in which an action can prevent a fatal event. If the action changes the direction or velocity of either parties sufficiently, then neither will be severely impacted. If the action is ineffective, then a fatality will most likely occur.
Action:The pedestrian or bus can be alerted and an appropriate response then needs to be undertaken by them. The pedestrian or bus can be be forcefully redirected by a third party.
No initial damage has occurred at the time of the signal. The time between signal acknowledgement to action and the resulting successful response is critical to averting a fatal incident.

3) An earthquake with a following tsunami.
Signal: An earthquake occurs. Depending on where in the world it happens, it may be common or uncommon. If the tide rapidly goes out at the beach, this means that a tsunami will come. If a loud roaring, like a train or a jet engine is heard, then the wall of water is approaching.
Impact:The scope of the initial damage that may have occurred depends on the earthquake readiness of the region, and the frequency that it has occurred in the past. There is a much greater impact that will occur in the coming period of the tsunami.
Action: Depending on where the epicenter of the earthquake is, the amount of time for action can vary. People should get to higher ground at least 100 ft above sea level or 2 miles away from shore at a minimum.
Some initial damage may have occurred but the worst is yet to come. Avoiding further and severe damage / harm is the best action until the risk subsides.
How would these three scenarios apply in an IT environment?
You can think of these as:
a) Reactive Systems
b) Trend Analysis
c) Anomaly Detection / Event Correlation Engines.
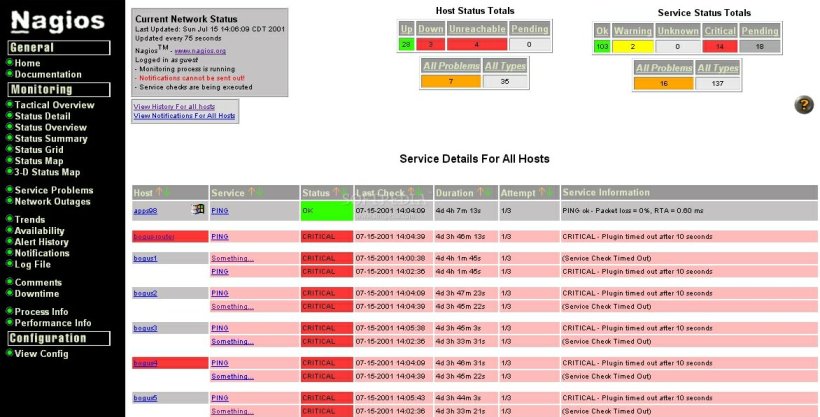
With a reactive system you see an alert, then you respond to it. This is a legacy monitoring system with SNMP, WMI, thresholds and ICMP response monitoring. These systems will tell you something is on fire and you will have to acknowledge, assess, and react. Software such as: Nagios, and Solarwinds IP Monitor fit into this category.
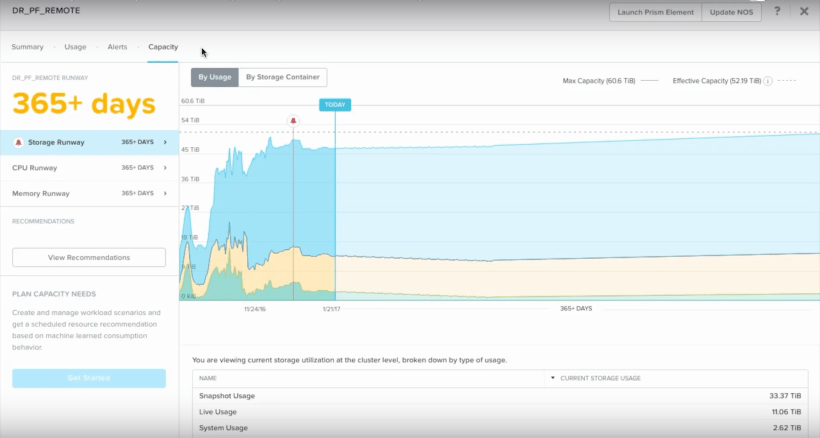
A trend analysis system is able to extrapolate a time period to an undesirable state based on the trend that has occurred over a period of time. A simple example of this is when a SAN is running out of space and based on the current rate of storage consumption, the estimated critical period is a couple months away. This give the operator time to “steer the bus” so to speak. Move data to somewhere else, delete non-desirable data, deduplicate, or acquire more space. Examples of this are: Nutanix Prism Pro, VMware vRealize Operations and Turbonomic.

Anomaly detection and event correlation engines have a mix of different ingestion methods, many of which overlap with trend analysis systems. So many of the examples stated for those systems, also apply to this category. One fundamental function of this type is log ingestion. Ingesting logs from multiple sources, correlating events and predicting outcomes. Examples of this are: Splunk, VMware vRealize Log Insight, Datadog and LogRhythm.
Though, software is just a tool. The real capabilities of an organization to utilize the software depends on the experience and capabilities of the operational staff. Investing in staff, processes and workflows, is more important than any piece of software. I would always recommend enabling staff education and encouraging continual learning before investing in any single solution. However, once a base level of competence is achieved capabilities can be dramatically improved by utilizing some of the software mentioned here.
References:
https://www.solarwinds.com/ip-monitor
https://www.nutanix.com/products/prism/
https://www.vmware.com/ca/products/vrealize-operations.html
https://www.vmware.com/products/vrealize-log-insight.html
Discover more from Designing Risk in IT Infrastructure
Subscribe to get the latest posts sent to your email.
